Funderblu Launches Comprehensive Evaluation Suite Featuring Industry-First Gen Z Plan
Funderblu launches a transparent prop trading evaluation suite with an industry-first Gen Z plan.

Market trends provide valuable insights into the direction of certain financial assets as well as several industrial sectors. Analysis of a financial asset’s return potential may be aided by familiarity with past market trends during inflation periods. Regular market analysis, including the use of automated trading algorithms, can also help you choose a specific industry in which to trade, optimizing your trading strategy with efficient and data-driven decision-making.
A market trend is like a general direction that shows how market values or asset prices are moving. It can go up, down, or stay the same (sideways). A trend can start at any time and in any direction. Usually, the longer a direction continues, the more likely it is to become a trend.
An asset’s price is in an uptrend when it continuously makes higher highs and higher lows. In a downtrend, the price consistently makes lower lows and higher highs. When the price oscillates between stable levels of support and the upper limit, the trend is sideways or horizontal. In terms of direction, speed, or momentum, different trends exhibit varying properties.
A price movement in an upward direction that is considered to be in an uptrend has maximums and lows that are higher than those of the previous periods. A pricing trend that is upward signifies a rise in price that happens gradually over time.
When the market price of security begins to fall, a downtrend begins to occur. When the price of the security starts to decline, often to its lowest point, trend traders would typically enter a short position in this scenario.
In the price chart, a sideways trend, also known as a flat, is shown by consecutive highs and lows that are roughly at the same level. The majority of trend traders typically overlook these tendencies. Yet, scalpers frequently benefit from a sideways trend in order to capitalize on relatively brief market fluctuations.
Understanding market trends is crucial because they provide insights into which assets are likely to increase in value and the level of risk involved. Selling an asset before it reaches its peak could result in missing out on significant profits. Similarly, buying an asset before it reaches its lowest point may lead to lower profits when you sell it later.
But, keep in mind that it is just one of many tools and strategies available. A trend line should only be used as a warning when it is broken to indicate that the trend might be shifting. To verify the change in trend, you should utilize extra tools and signs.

Trading Indicators are a group of tools used on a trading chart to assist make the market more understandable. Additionally, indicators can provide specific market data, such as when an item is overbought or oversold relative to its price range and is therefore due for a reversal.
Trend indicators reduce chaotic and variable candle prices to a single, consistent line. The goal is to identify trends, follow them, and predict when they may reverse or range before making a trading choice.
This indicator lets you know how strong the trend is and whether a reversal is likely to happen. Relative Strength Index (RSI), Stochastic, Average Directional Index (ADX), and Ichimoku Kinko Hyo are examples of momentum indicators.
The volume represents the number of contracts traded for a specific asset over a given time period. This will enable you to gauge a trend’s intensity and direction. Volume appeals to traders because, like volatility, it generates trading opportunities.
Volatility indicators measure price volatility and show when a market is more erratic and receiving higher volume. The price is thus forced to start trending and favors longer holdings as a result of having fewer range opportunities when it is more volatile.
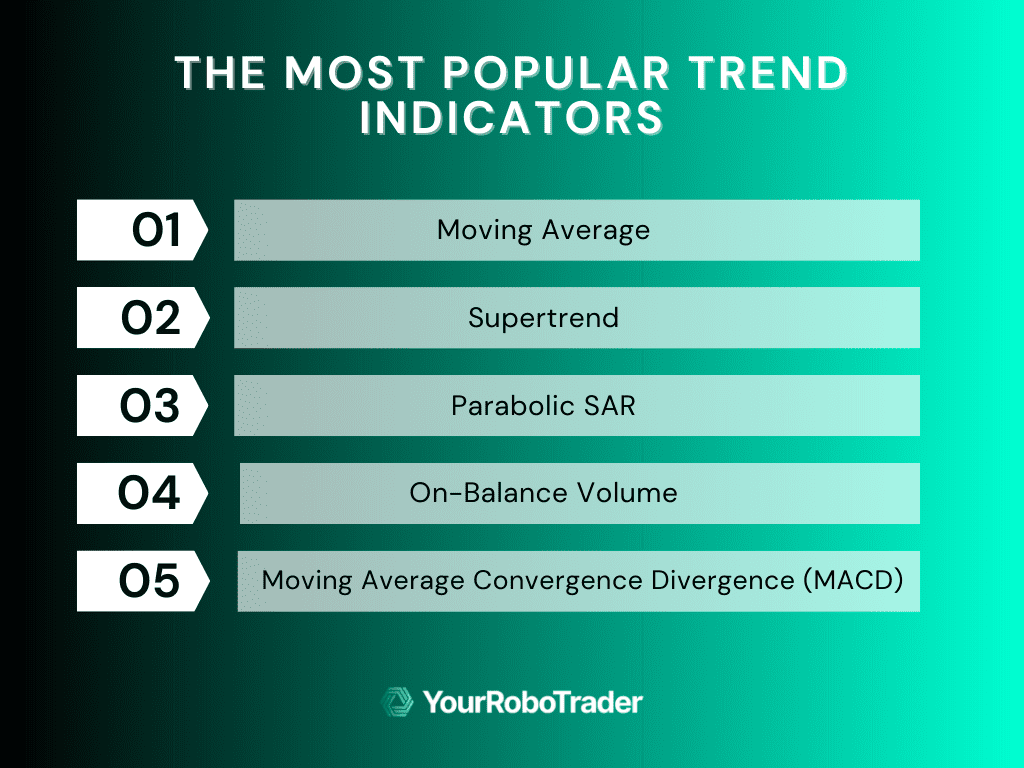
A moving average is a trend indicator that continuously creates average prices to smooth out price data. Any time frame, such as 10 days, 30 minutes, one week, or any other time frame the trader chooses, can be used for the average. The 200-day, 100-day, and 50-day simple moving averages are common moving averages used by long-term trend traders.
Supertrend is a trend indicator that shows whether or not a market’s price movement is trending. The indicator’s color changes in response to a shift in the trend’s direction. The supertrend indicator changes to green and issues a buy signal when it moves below the closing price. A sell signal is displayed in red on the indicator if a super-trend closes above.
The Parabolic SAR is a technical indicator invented by J. Welles Wilder to determine the direction of an asset. The stop and reverse system, often known as the indication or SAR, is another name for it. Wilder advises traders to utilize different indicators to gauge the trend’s strength after first determining the trend’s direction using the parabolic SAR.
On-Balance-Volume (OBV) is a term used to describe the flow of trading volume for securities across time. A growing OBV indicates buyers who are more willing to enter the market.
Moving average convergence divergence (MACD) is a type of oscillator. Technical analysis indicators that fluctuate over time inside a band are known as oscillating indicators. Two lines make up a MACD which is a fast line and a slow line. As the fast line passes through and over the slow line, a buy signal is generated. As the fast line passes through and falls below the slow line, a sell signal is generated.
These trend indicators are more common these days due to the widespread adoption of online trading. Although all of the trend indicators we’ve covered above are extensively utilized, it’s important to keep in mind that no indicator provides 100 percent accurate findings.
Trend trading has been consistently successful throughout the history of markets. This success will continue into the future because trends exist, can be discovered, and can be traded profitably once identified. However, it is important to remember that risks are always present.
Our company specializes not only in the development of new trading systems, we also offer many other services.
Funderblu launches a transparent prop trading evaluation suite with an industry-first Gen Z plan.
In algorithmic trading, your strategy is only as good as your broker's infrastructure. You may...
Cryptocurrency trading mirrors the algorithmic dominance long seen in Forex, commodities, indices, equities, and derivatives....
We invite you to explore the world of algorithmic trading with YourRoboTrader. Apply Now for a Consultation Session and discover how our algorithms can help you achieve your trading goals.